The next version of your RIA needs better numbers.
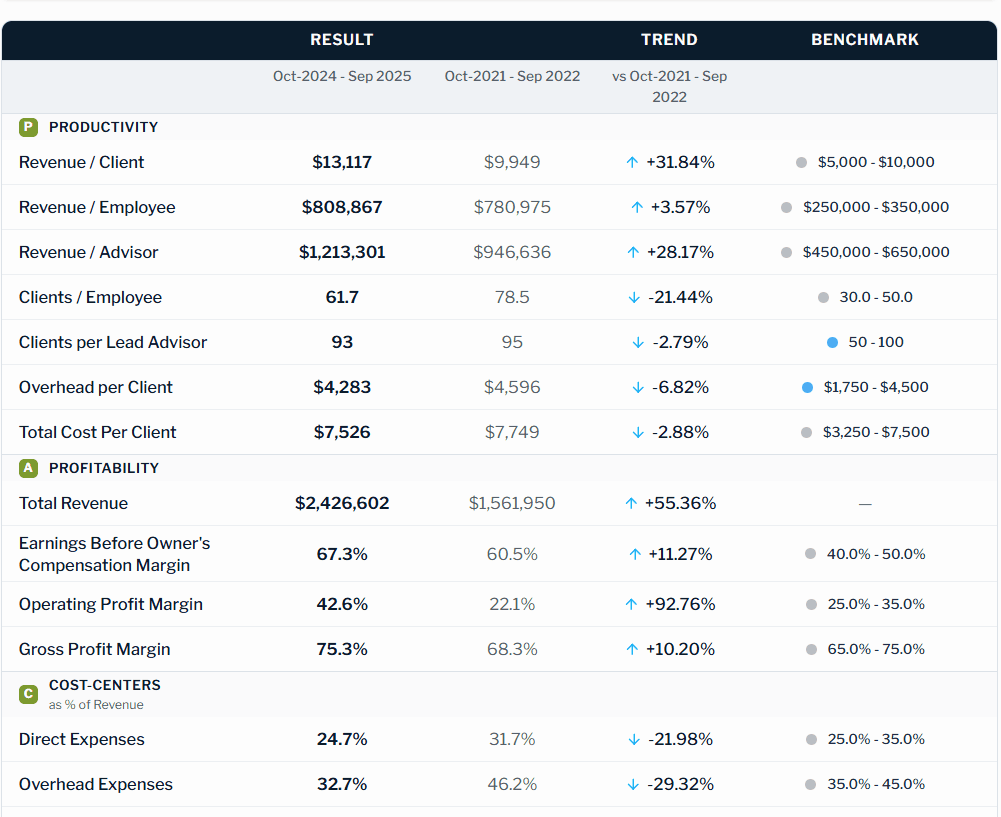
Make confident hiring and growth decisions. AdviceEconomics turns your QuickBooks data into a KPI dashboard with benchmarks.

Built on Michael Kitces' methodology for advisory firm financial analysis
Hire, cut costs, or graduate clients? Hard to know without the numbers.
You suspect you should hire — but can't prove the timing is right.
You think costs are too high — but aren't sure what's actually out of line.
Your peer group compares numbers — but everyone defines 'profit' differently.
Your spreadsheet works — but only the person who built it understands it.
You've tried spreadsheets, and QuickBooks reports. Still no clear answer.
See what your numbers are trying to tell you
AdviceEconomics turns your QuickBooks data into a KPI dashboard with benchmarks, trends, and guidance — so you can make growth decisions with confidence.
Benchmarks against similar firms
So you know what 'good' actually looks like.
Trends over time with context
So a dip is a data point, not a panic.
Linked articles and implications
So you know what to do, not just what the number is.
Dashboard in 24 hours
Sign up
Name, email, and CRD (optional)
Upload
Chart of Accounts + General Ledger
Get your dashboard
Within 24 hours
Everything you need to decide — in one view

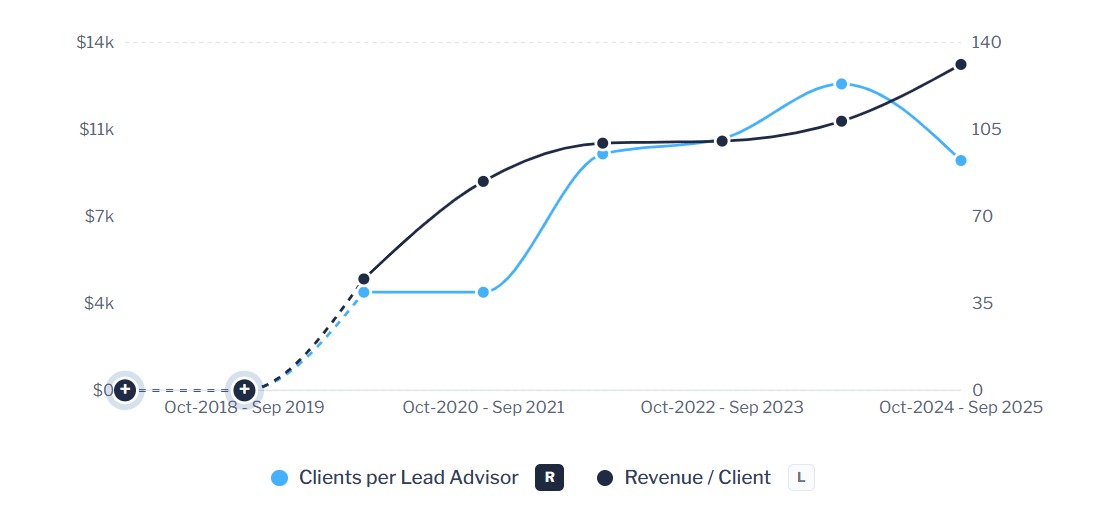
Two numbers explain a lot: higher revenue per client signals stronger client economics, and clients per advisor shows whether the firm is scaling sustainably.
RIA owners who stopped guessing
Each quarter, it takes me time to assemble metrics for my coaching program. If I had this dashboard, it would be a quick turnaround. Heck, I would pay for this just to see all this right now.
When you're showing each other numbers in a mastermind group, you don't really know — are we looking at this the same way? One advisor's 'profit' is just revenue minus expenses. This dashboard would be a great way of standardizing that so we can actually compare.
This is for you if...
- Actively making decisions about hiring, costs, or client capacity
- Over $200K in revenue
- QuickBooks Online (with at least one year of data)
- Fee-only RIA (AUM, planning fees, or retainers... reporting for independent broker-dealers coming soon!)
This is NOT for you if...
- Your firm does significant tax prep, accounting, or insurance
- You just want confirmation things are "fine"
- You're not on QuickBooks Online
Stop guessing. Start measuring.
Sign up, upload your QuickBooks export, and get your dashboard within 24 hours.